Posted in: Sparks - Ideas, connecting the dots
Unfolding the interrelationship diagram
By Ryan Singer •
A while back, I learned this technique from Bob.
Sometimes I'm working on a design problem, and there are too many things to solve. They all seem tangled together, and I don't know where to start. I'm afraid that if I start on the wrong thing, I'll paint myself in a corner or go down the wrong path and have to start all over again.
A tool to deal with this is the "interrelationship diagram." It's a systems-thinking thing. Basically, you brain dump all of the disconnected parts and figure out what is connected to what. Then you can identify the bigger chunks to work on and see which chunk to do first.
It works like this. First you write down every thing you think you have to build and number each one. Then arrange the numbers around a circle:
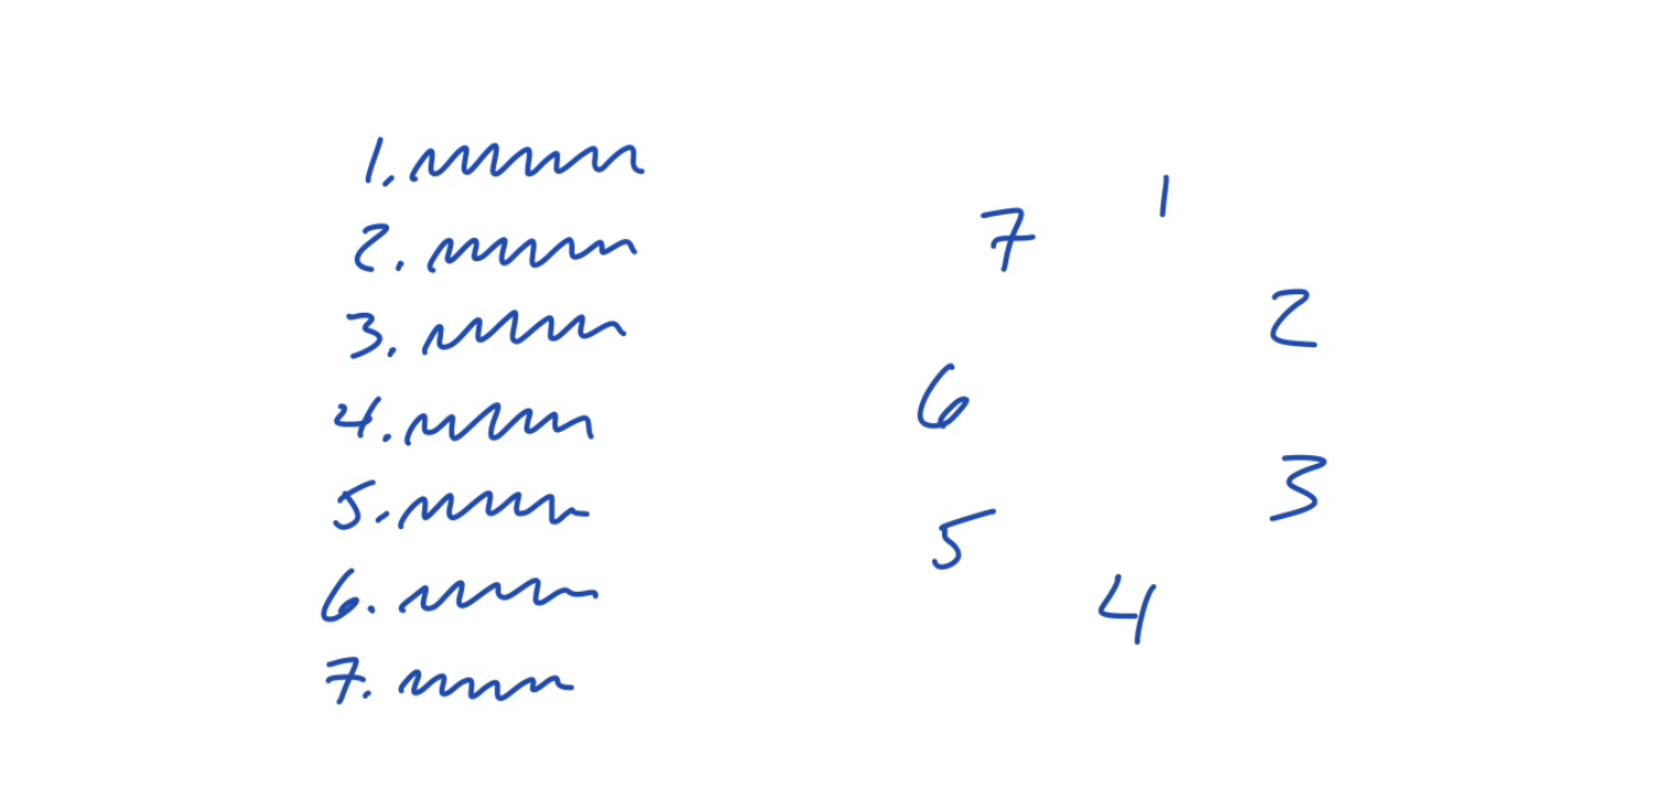
Then, draw an arrow when doing one thing will help you to do the other thing. This reveals the causal structure of how things are connected.

Last, you count the arrows to see which things have more outgoingthan incoming connections. Those are the things that have more influence on the rest of the system and should be solved first. In this case, #2 is the thing to do first, because things #5 and #6 depend on it, and that unlocks doing #4.
You can do this on paper or a whiteboard. Lately I've been making them in OmniGraffle, and this led to a surprising next step.
Here's a real project from last week. I brain dumped a list of pieces from the design that were in my head and drew connections between them.
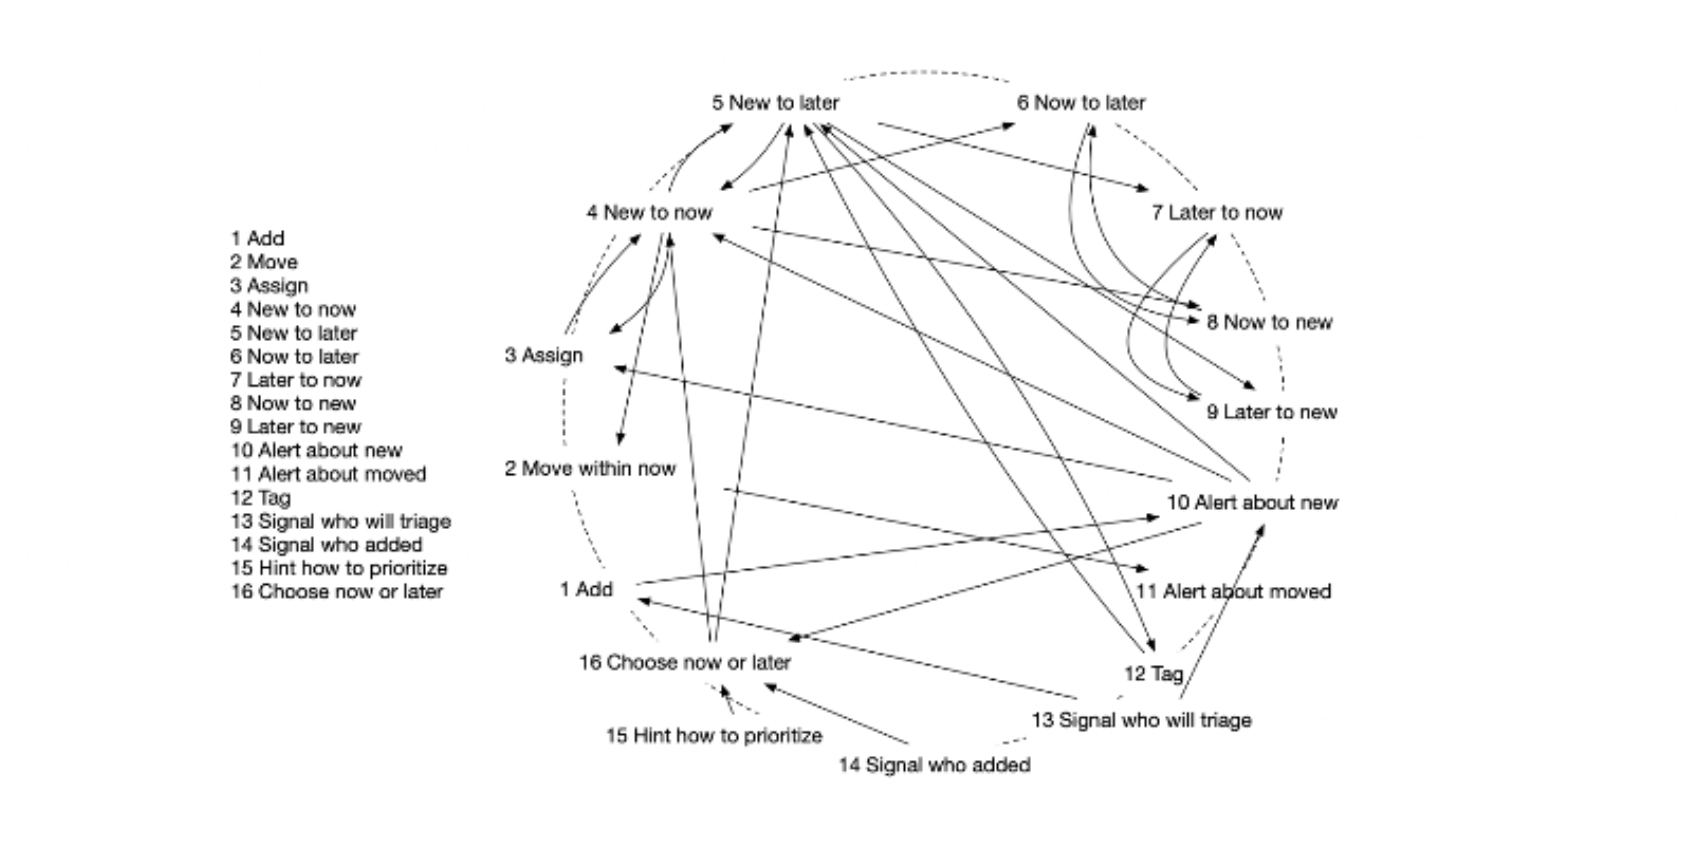
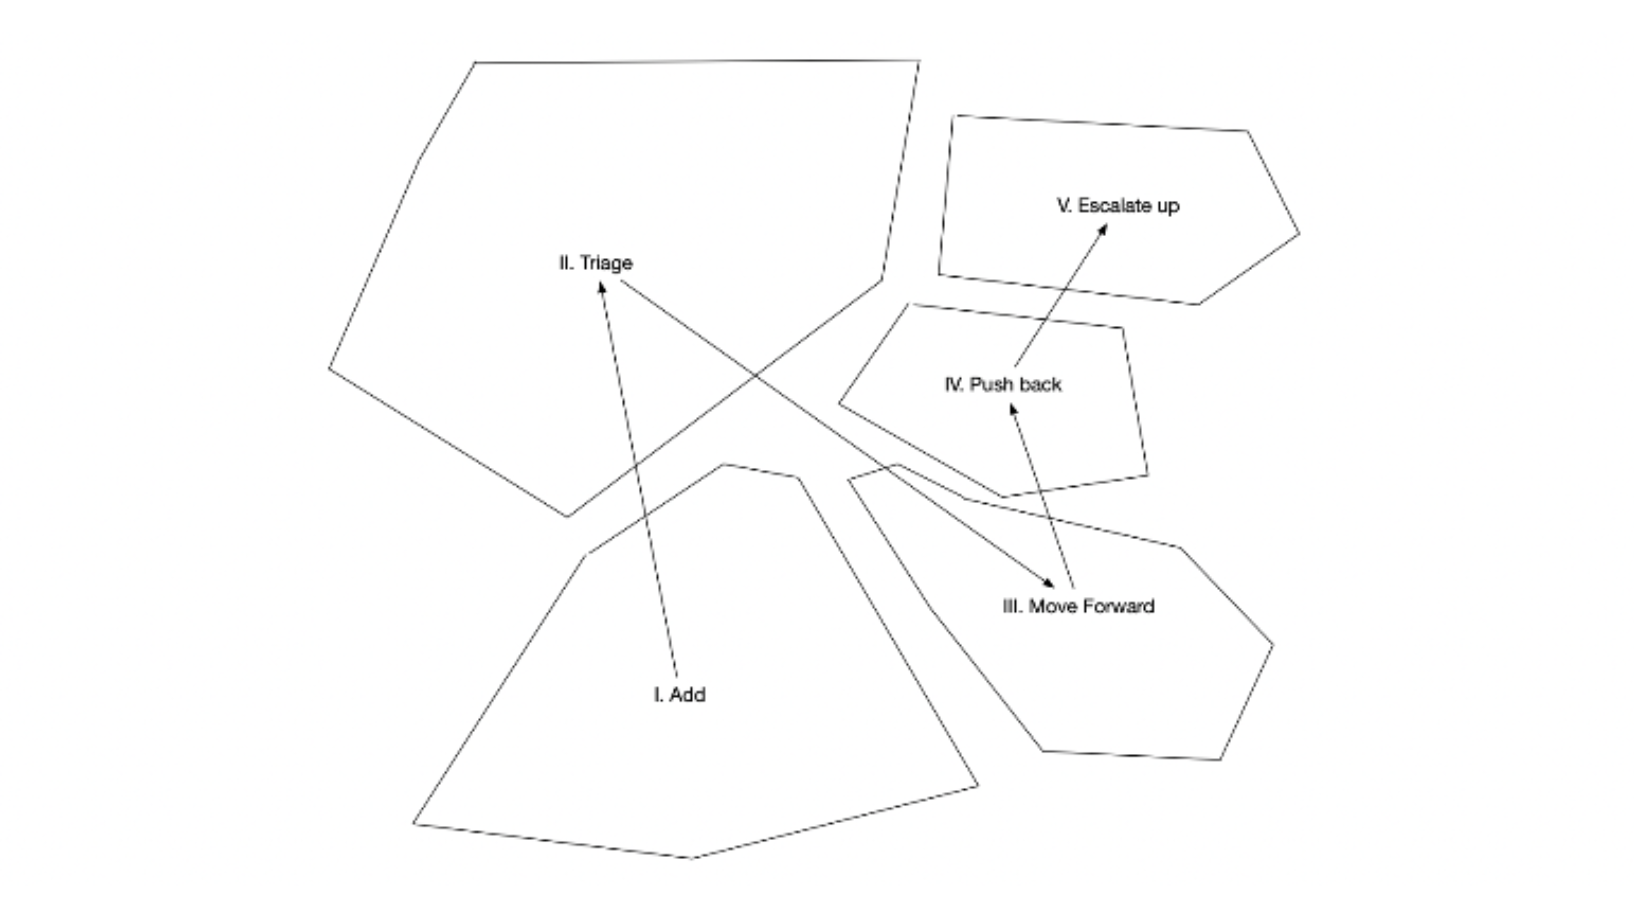
Now the cool thing. Because OmniGraffle is a diagramming tool, the arrows are all connected magnetically to the text labels and they stretch as you move the labels around. That means that after the connections were defined, I could drag the labels around to "unfold" the network.
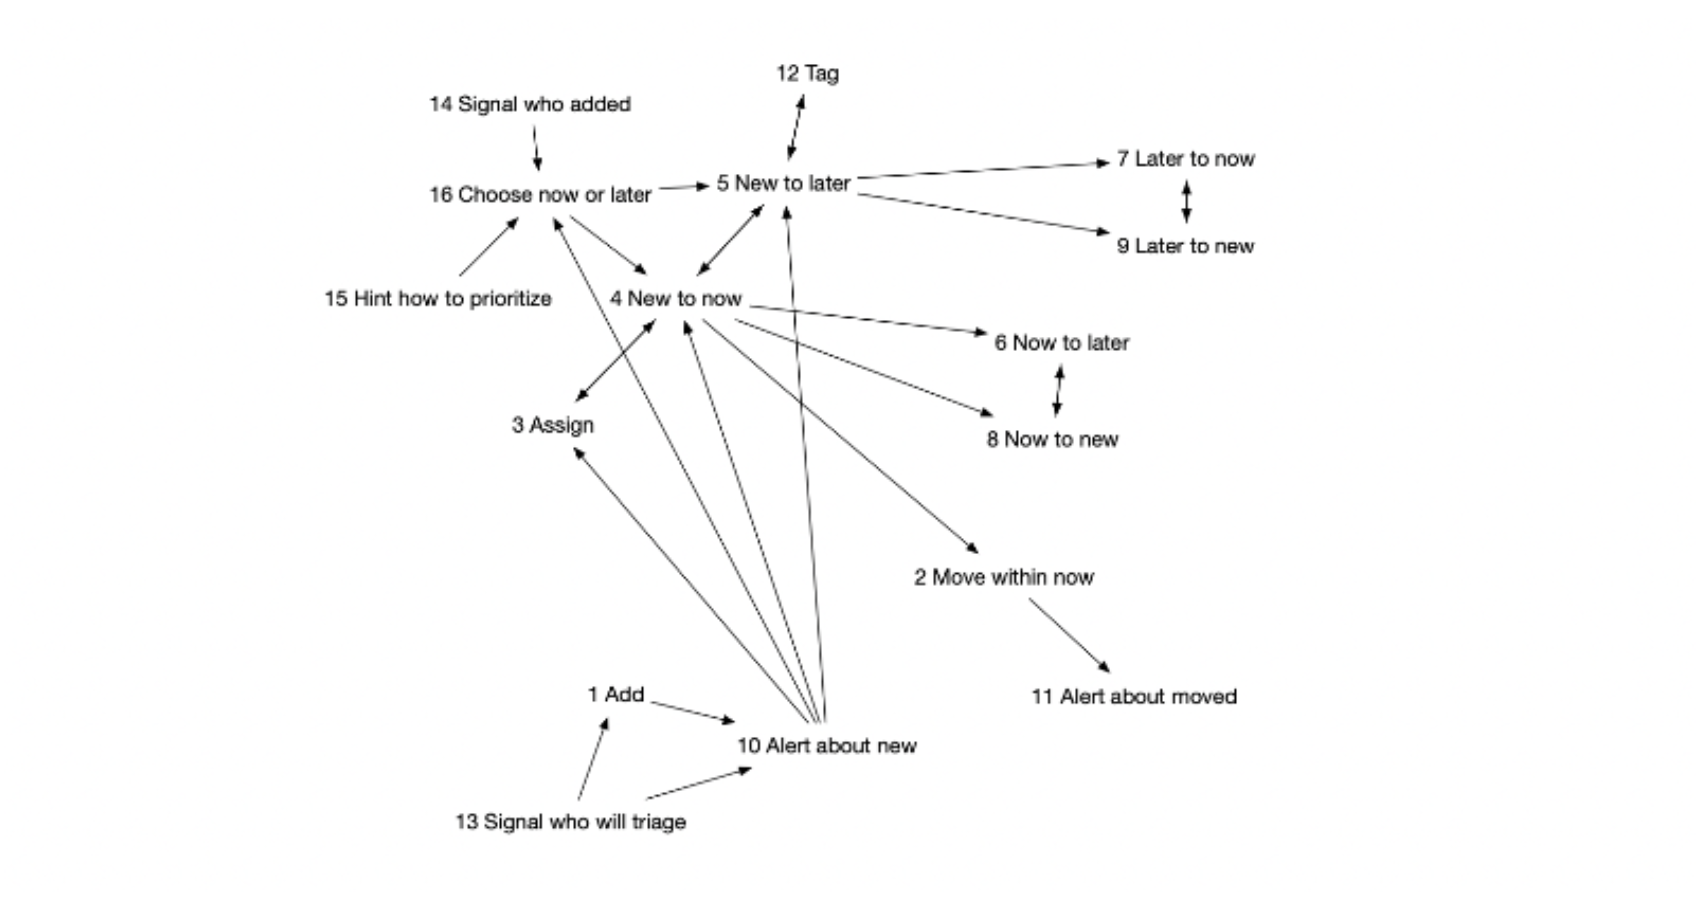
Now that it's unfolded, I do could more than just count the incoming and outgoing arrows. This flattened version of the network made it easier to see the bigger chunks of things.
From here, it was natural to draw borders around the main chunks. Each chunk is a part of the network with more internal dependencies than external dependencies. (If you know Notes on the Synthesis of Form, this may give you flashbacks.)

First I drew the borders, and then I wrote names to describe the contents of each chunk. Wait a minute ... this is the same thing as scope mapping in Shape Up. These are scopes!
From here, I could reduce the network to just the scopes and define a sequence to tackle them.
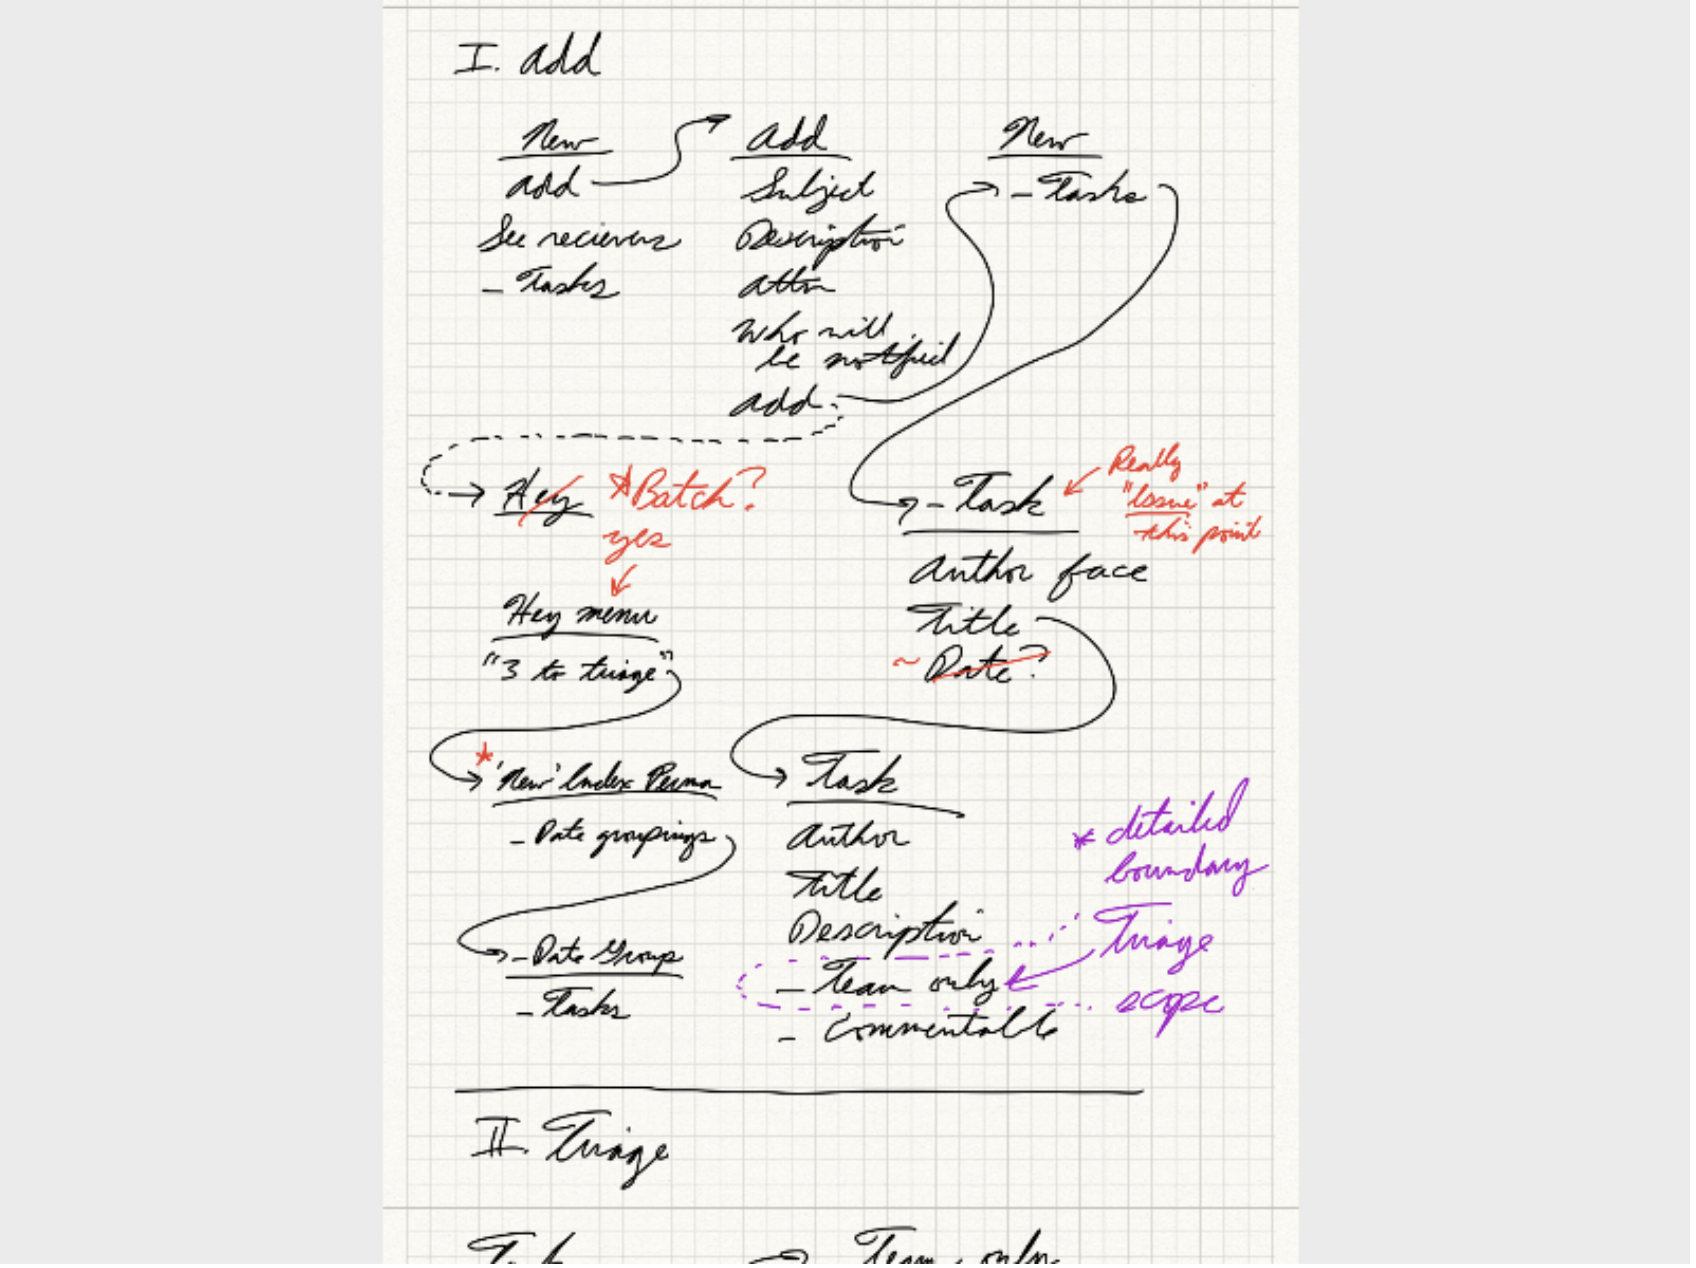
This gave me more confidence to dive into the weeds. I started on the first scope ("Add"), looked at the everything in its local network, and started sketching.