Posted in: Sparks - Ideas, connecting the dots
Measuring usage with a Taguchi signal/noise ratio
By Ryan Singer •
Bob's been slowly schooling me in Taguchi methods over the last couple years. I'm starting to make some small steps towards applying them to software projects.
My favorite so far is the signal/noise metric. Here's how I understand it so far.
How do we know if a product is working "as it should" for people? For example, we could write automated tests that prove the mechanism for inviting people to Basecamp projects works as intended. But what if somebody gets added to a bunch of projects that don't matter to them? Now their Basecamp account is full of irrelevant projects. Is that "working"?
Supposed we wanted to try and measure this. What's the "right" number of projects a person should have? No idea! There's no "right answer" to that question.
We can get a new perspective by rethinking how we define the system to be measured. Every function can be thought of as having an input signal and an output response. In the case of inviting someone to a project in Basecamp, the desired output response isn't "it shows up on their account." Basecamp isn't a tool for making things appear on a screen! A better response is "when I share something with them, they look at it."
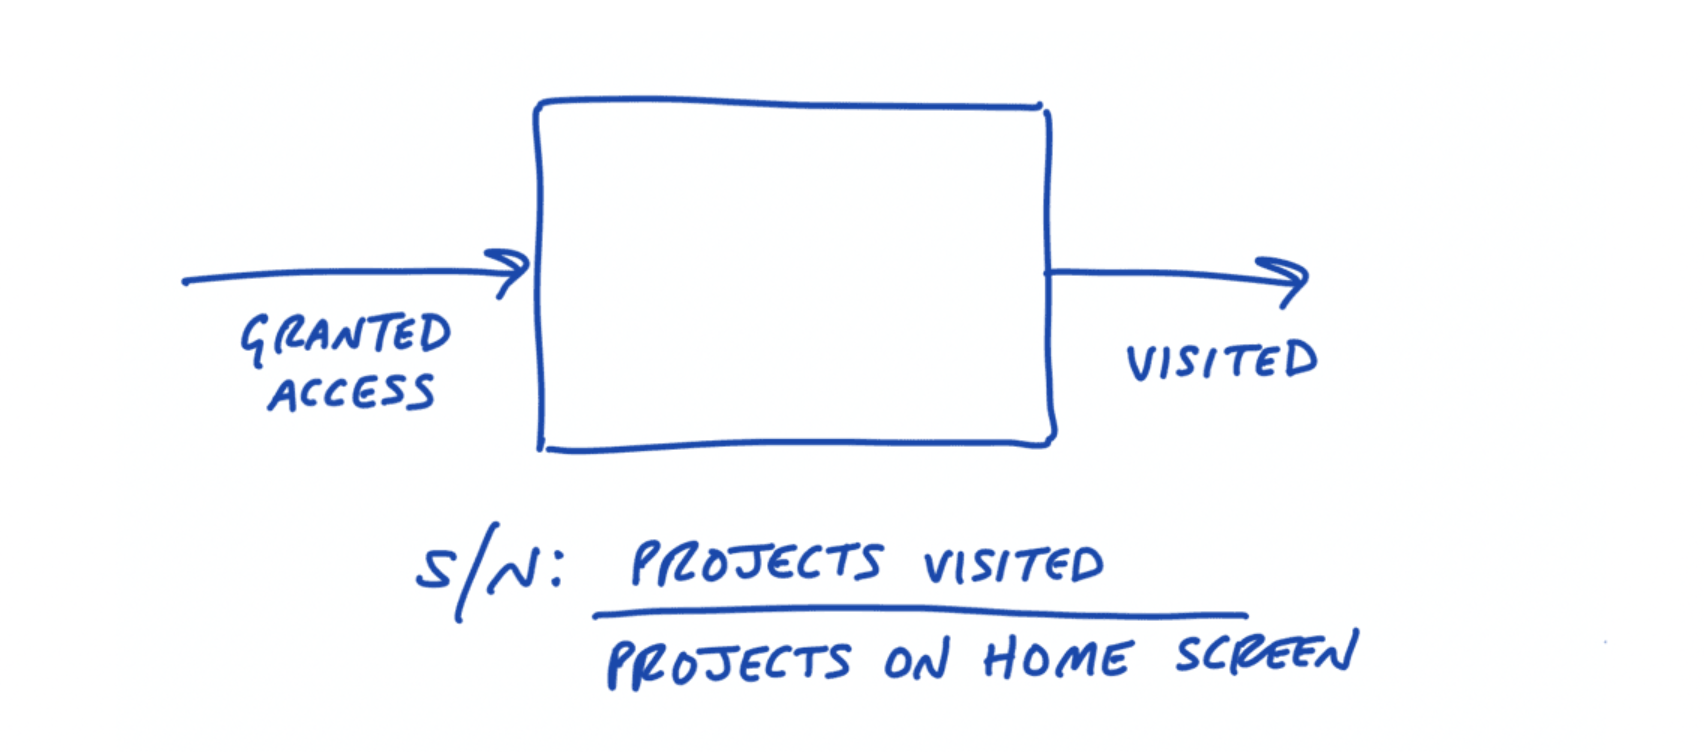
Having reframed the function like this, we can define a signal/noise ratio. The output of the function of course includes showing the project on the home screen. But the meaningful response is more than that. It's the fact that the person granted access actually looks at the project. This means we can say that just populating their account with another project is noise when they don't also look at it.
This metric doesn't say anything about how many projects are good or bad. It tells us whether the feature is being used as intended.
"Intent" is the special ingredient when defining a system with Taguchi methods. By better understanding the intent, we can look at the variation of the functionality to say when the output should be considered signal or noise.
This metric is striking when graphed. The images below show data from Basecamp's own Basecamp account. The X axis is S/N, from 0 to 100% (0 to 1). The first graph shows that nearly all of us in the company only look at half of our projects (in a 30 day period).
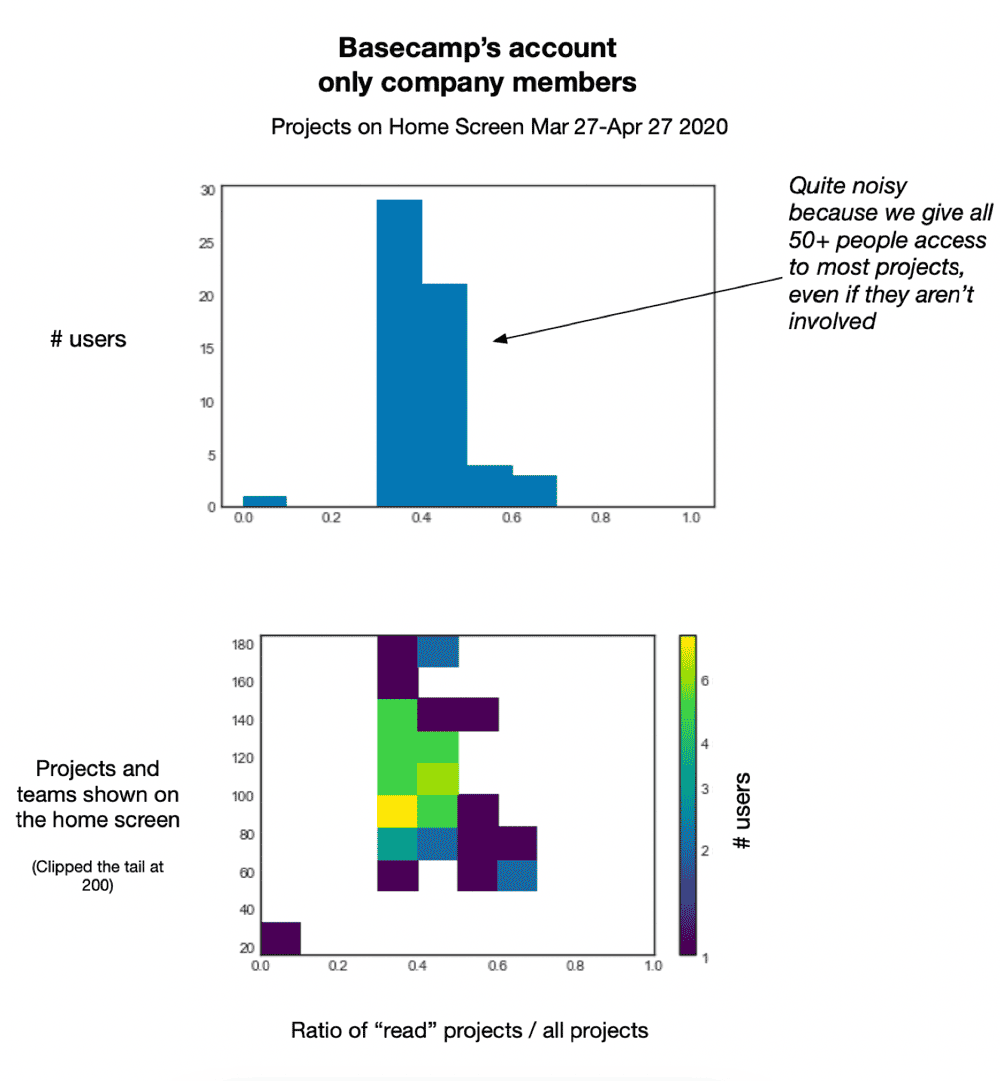
The second graph adds another dimension, showing the S/N per person and per number of projects.
What this tell us is, the single action of "granting access" is very imprecise — even for us, the Basecamp experts. In reaction to this, I've shaped a new take on project access for BC4 that distinguishes between different kinds of expectations for participation. This will allow us to give the function a more specific "signal" for the intent of adding someone who is a participant vs. adding someone who should just have access for reasons of transparency. This metric will allow us to concretely test to see if we've improved the ratio if/when we start using the new feature internally.